Statistics and Open Data
As part of the HRLSC’s commitment to providing quality services to clients and open and transparent operations, we collect and share information about who and how we help provide legal advice and support to people across Ontario.
The HRLSC records and reports on the quarterly and yearly statistics for its client services.
On this page:
2023 – 2024 Statistics
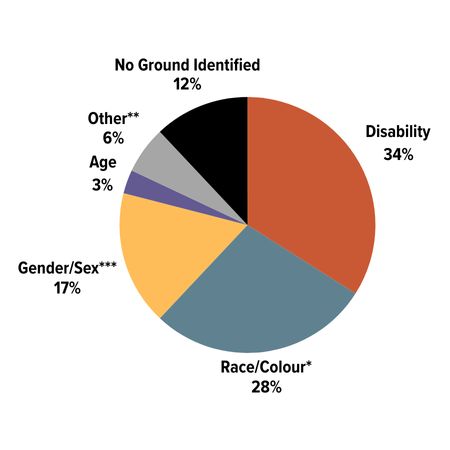
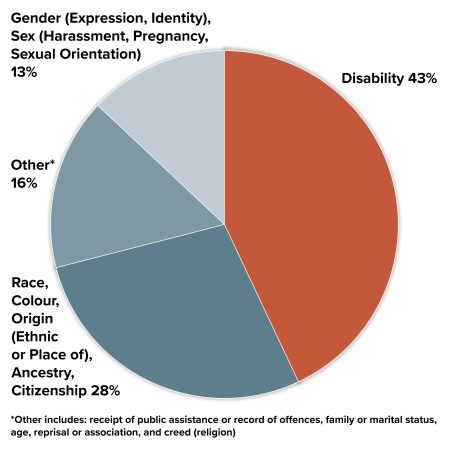
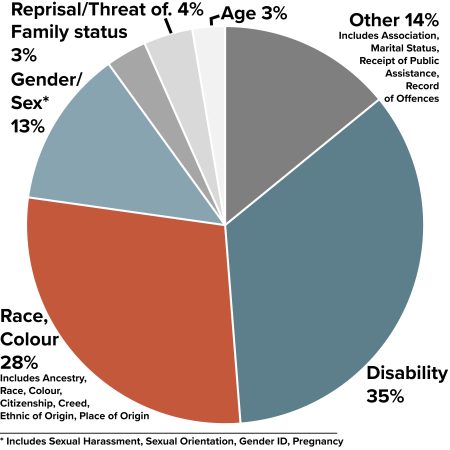
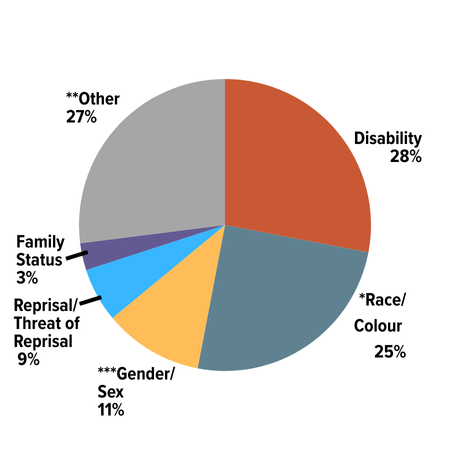
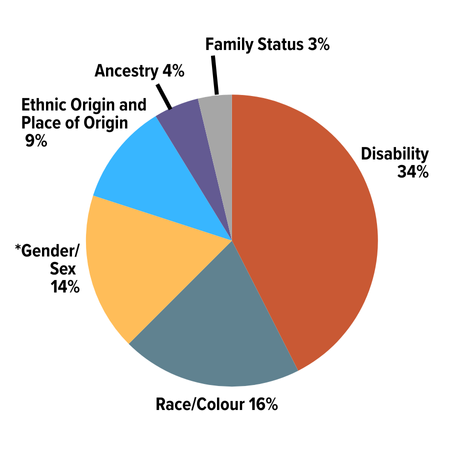
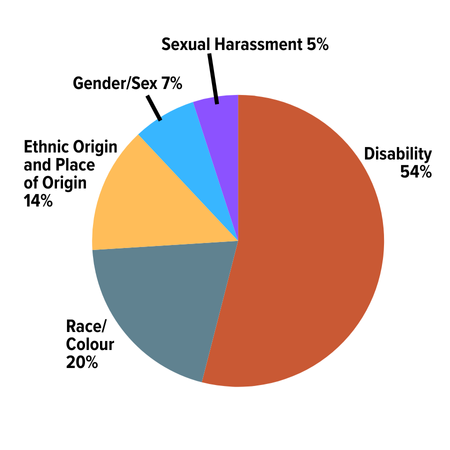
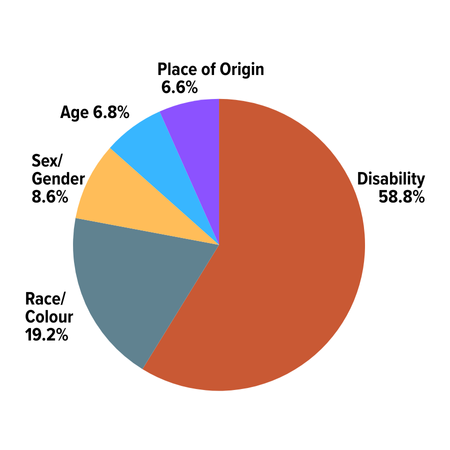
2023 – 2024 Intake by Grounds of Discrimination:
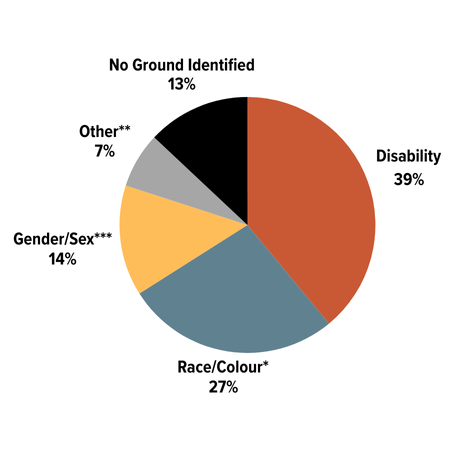
**Includes Association, Age, Receipt of Public Assistance, Record of Offence, Reprisal (or threat of Reprisal)
***Includes Pregnancy and Sexual Harassment, Family and Marital Status, Gender Identity and Expression, and Sexual Orientation
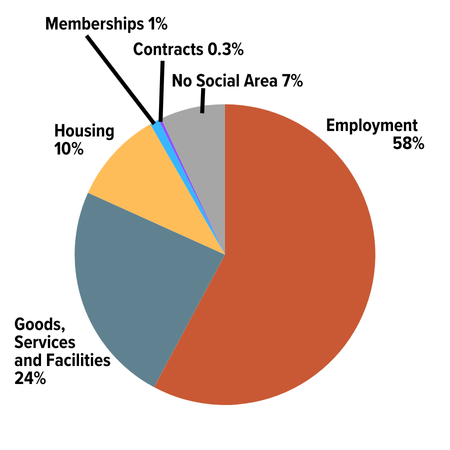
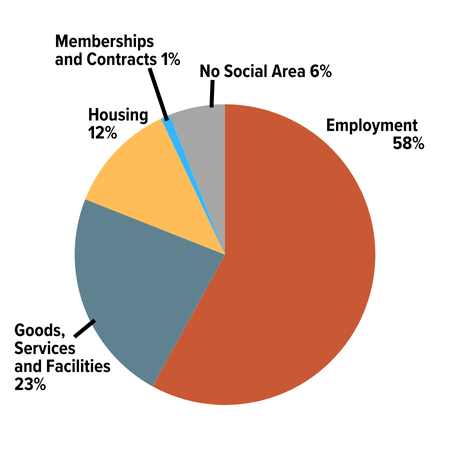
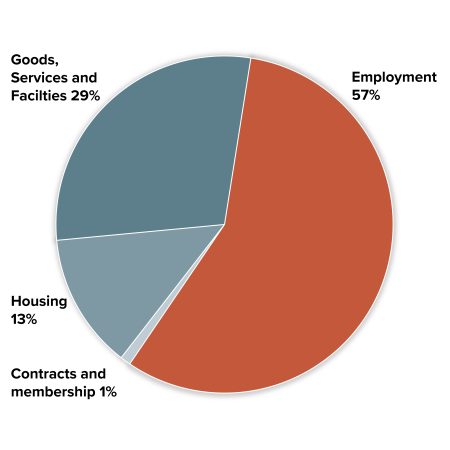
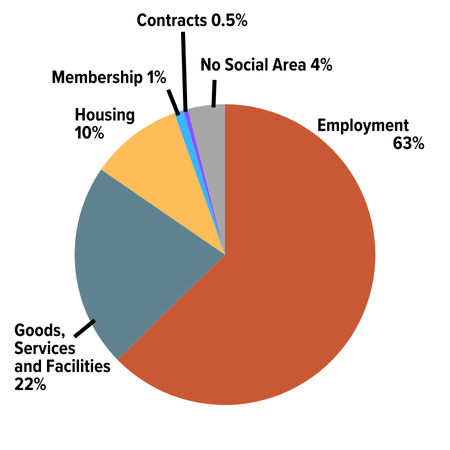
2023 – 2024 Intake by Social Area:
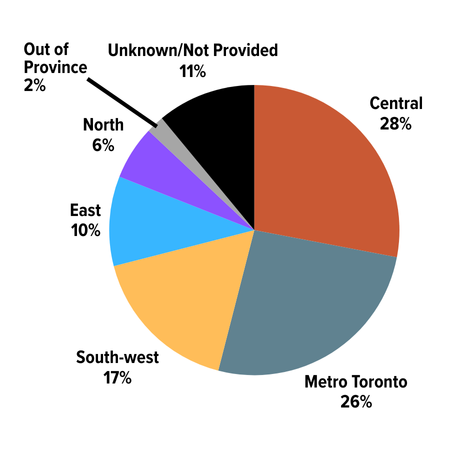
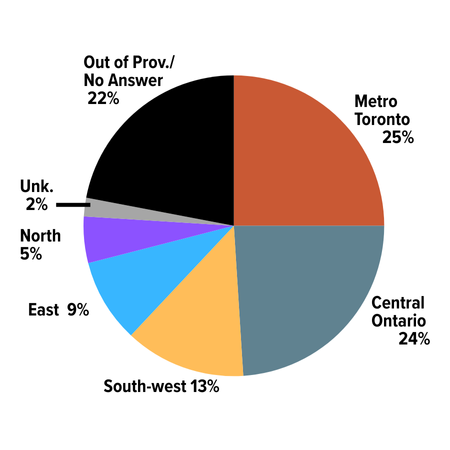
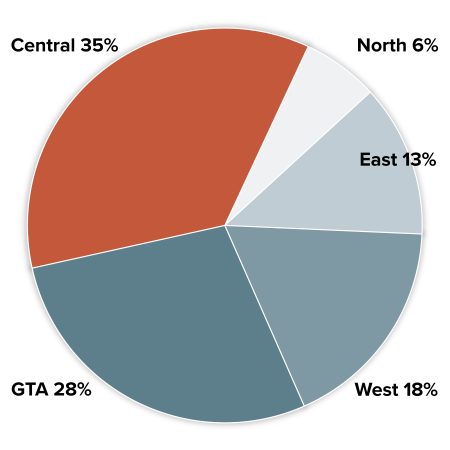
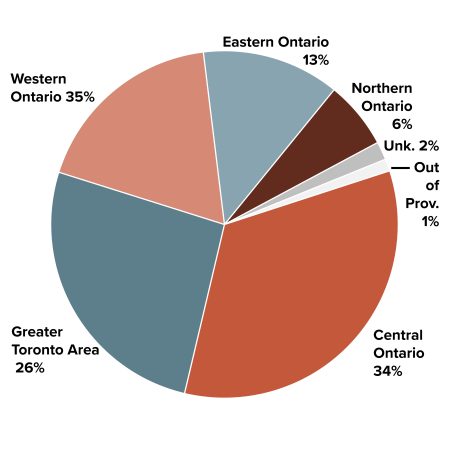
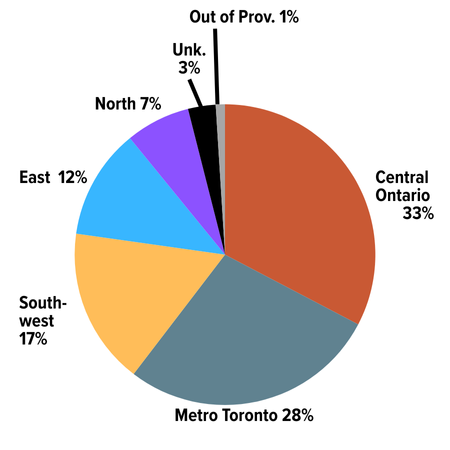
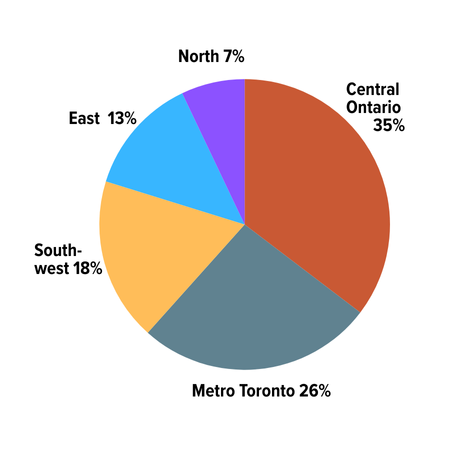
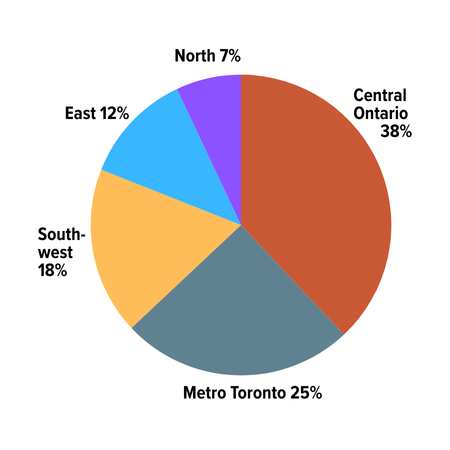
2023 – 2024 Inquiries by Region
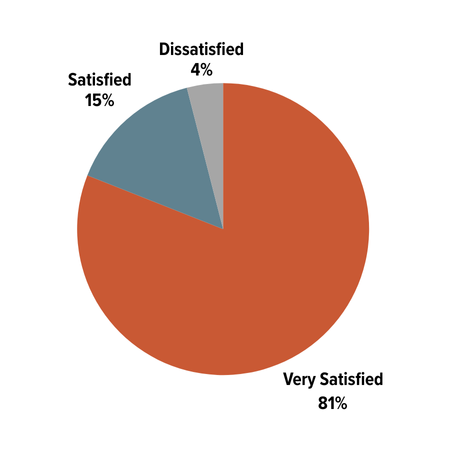
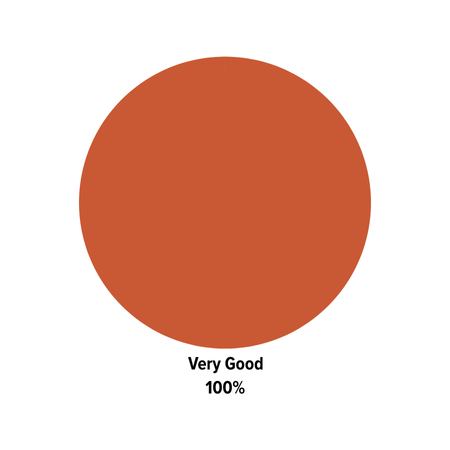
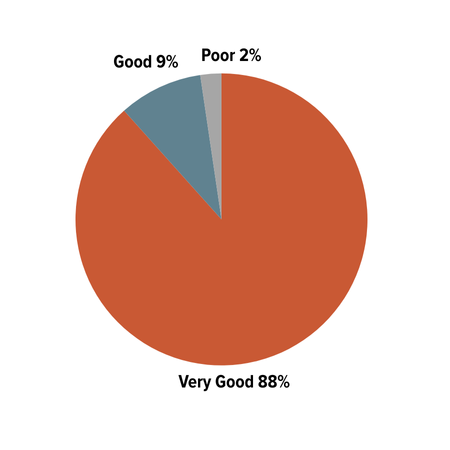
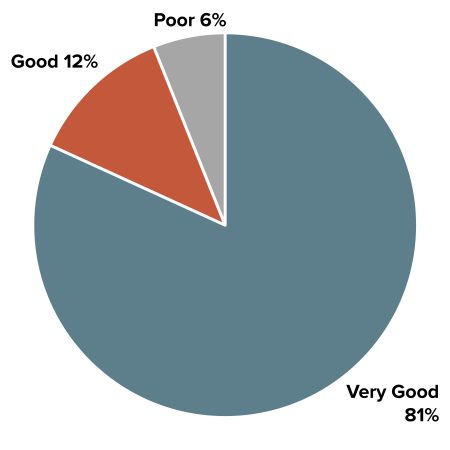
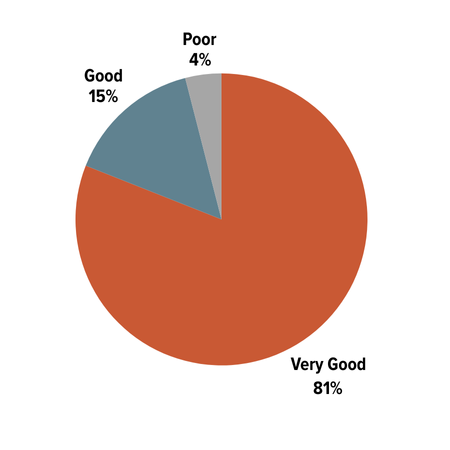
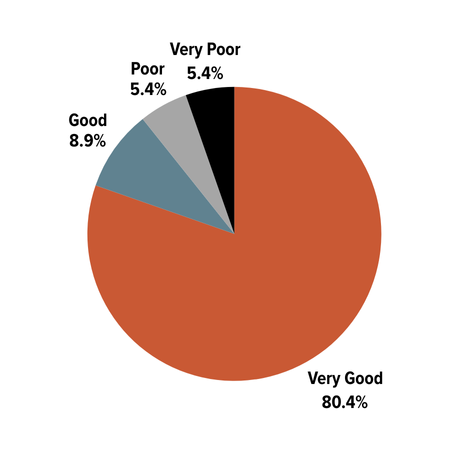
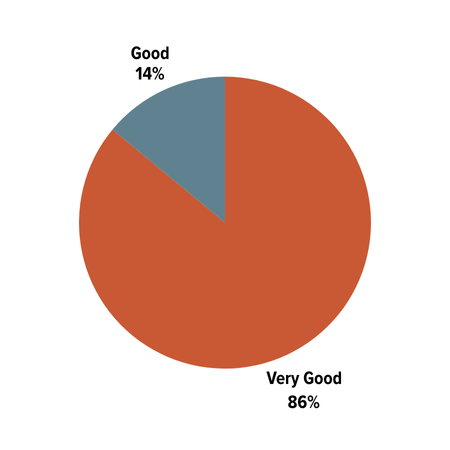
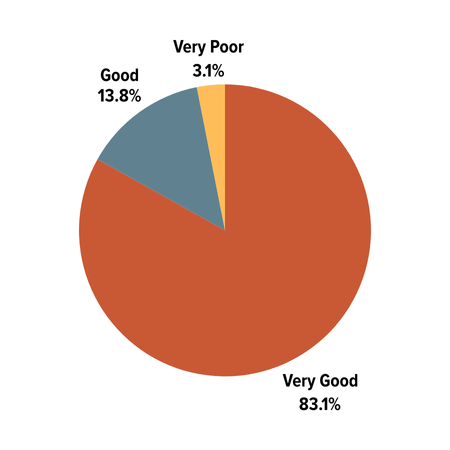
2023 – 2024 Client Satisfaction
2022 – 2023 Statistics
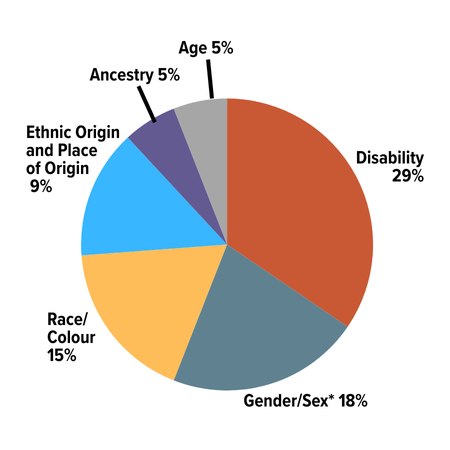
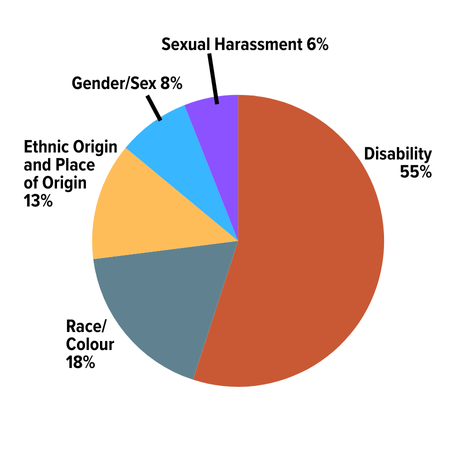
2022 – 2023 Intake by Grounds of Discrimination:
**Includes Association, Creed, Receipt of Public Assistance and Record of Offences, Reprisal or Threat
***Includes Sexual Harassment, Sexual Solicitation, Pregnancy; Family Status; Marital Status; Gender Expression and Identity; and
Sexual Orientation
2022 – 2023 Intake by Social Area:
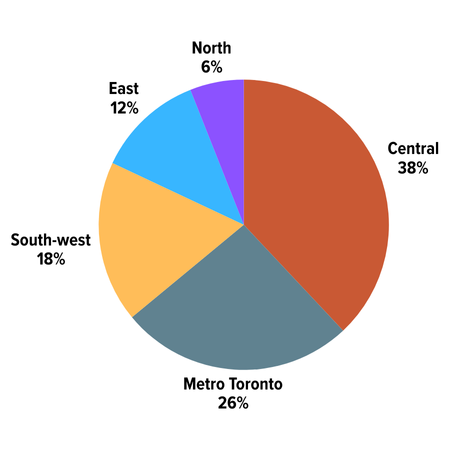
2022 – 2023 Inquiries by Region
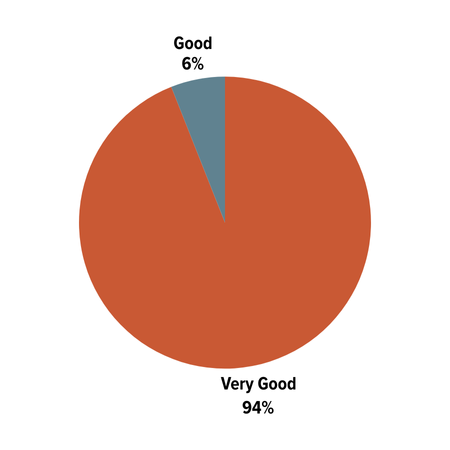
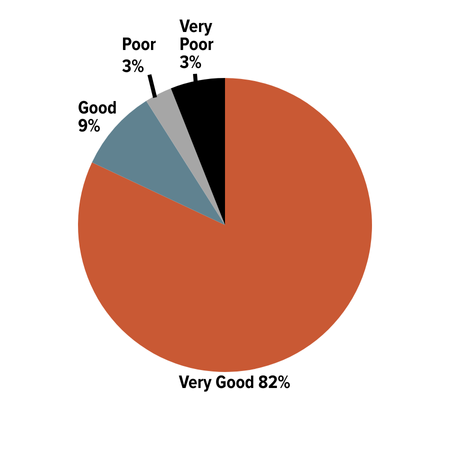
2022 – 2023 Client Satisfaction
2021 – 2022 Statistics
2021 – 2022 Intake by Grounds of Discrimination:
2021 – 2022 Intake by Social Area:
2021 – 2022 Inquiries by Region:
2021 – 2022 Client Satisfaction:
2020 – 2021 Statistics
2020 – 2021 Intake by Grounds of Discrimination:
2020 – 2021 Intake by Social Area:

2020-2021 Inquiries by Regions:
2020-2021 Client Satisfaction:
2019 – 2020 Statistics
2019 – 2020 Intake by Grounds of Discrimination:
*Includes Ancestry, Ethnic Origin and Place of Origin
**Includes “all other grounds” as of 2019 – 2020 under the Code.
***Includes Sexual Harassment, Sexual Orientation, Gender Identity,
Gender Expression and Pregnancy
2019 – 2020 Intake by Social Areas:
Inquiries by Region 2019 – 2020:
2019 – 2020 Client Satisfaction :
2018 – 2019 Statistics
2018 – 2019 Intake by Grounds of Discrimination:
2018 – 2019 Client Satisfaction:
2017 – 2018 Statistics
2017 – 2018 Intake by Grounds of Discrimination:
*Includes Sexual Harassment, Sexual Orientation, Gender Identification and Pregnancy
2017 – 2018 Inquiries by Region

2017 – 2018 Client Satisfaction
2016 – 2017 Statistics
2016 -2017 Intake by Grounds of Discrimination:
2016 – 2017 Inquiries by Region
2016 – 2017 Client Satisfaction
2015 – 2016 Statistics
2015 – 2016 Intake by Grounds of Discrimination:
2015 – 2016 Inquiries by Region
2015 – 2016 Client Satisfaction
2014 – 2015 Statistics
2014 – 2015 Intake by Grounds of Discrimination:
2014 – 2015 Inquiries by Region
2014 – 2015 Client Satisfaction